Tutorial 5 of 6
Statistics and cumulative flow
Intermediate 8 min
How Laneboard measures lead time, cycle time, throughput and work in progress from the card history, and how to read the cumulative flow chart of a board.
Every time a card enters a list, Laneboard writes down the time. From that history, Statistics in the board bar works out how your work flows: how long cards take, how many get finished and where they pile up. Nothing leaves your browser for this.
The two lists that matter
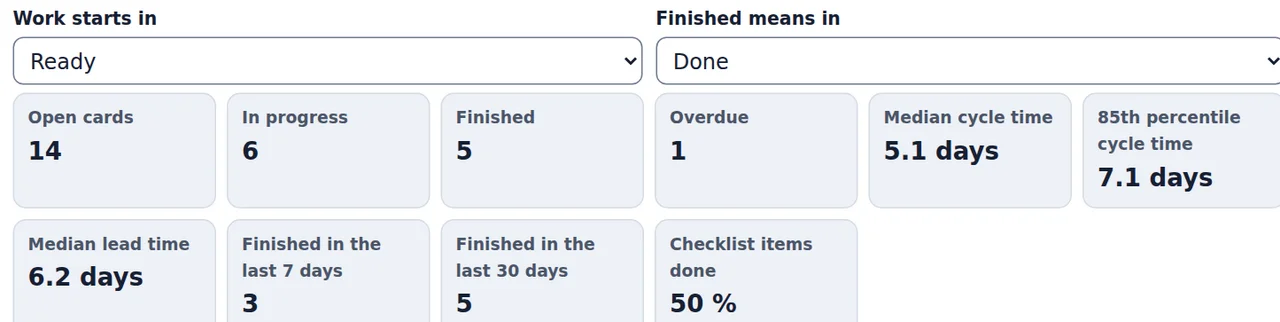
At the top of the dialog choose Work starts in and Finished means in. By default work starts in the second list (the first is usually a backlog) and finishes in the last one. On the hiring board, for example, you might pick Screening and Hired.
What the numbers mean
- Lead time runs from the moment a card was created to the moment it last entered the done list.
- Cycle time runs from the first time the card reached the start list (or any list after it) to the same moment. It tells you how long the actual work took, without the waiting time in the backlog.
- Median is the middle value; 85th percentile means that 85 out of 100 cards were finished within that time — a good number to answer “when will this be done?”.
- Finished in the last 7 / 30 days is the throughput: cards that reached the done list in that time.
- Oldest work in progress lists the cards that have been in progress the longest — good candidates to talk about first.
On the sprint template the median cycle time is 5.1 days and the 85th percentile 7.1 days; three cards were finished in the last week.

Further tables show the open cards per list against their WIP limits, overdue cards with the days they are late, and the unfinished cards per label and per assignee (including Nobody).
Reading the cumulative flow chart
The chart shows, for every day, how many cards were in each list at the end of that day. The last list sits at the bottom, the first at the top, so:
- the top edge is everything that has arrived on the board;
- the bottom band grows with every finished card;
- the height of a band in between is how much work waits in that list;
- a band that keeps getting wider is a bottleneck.
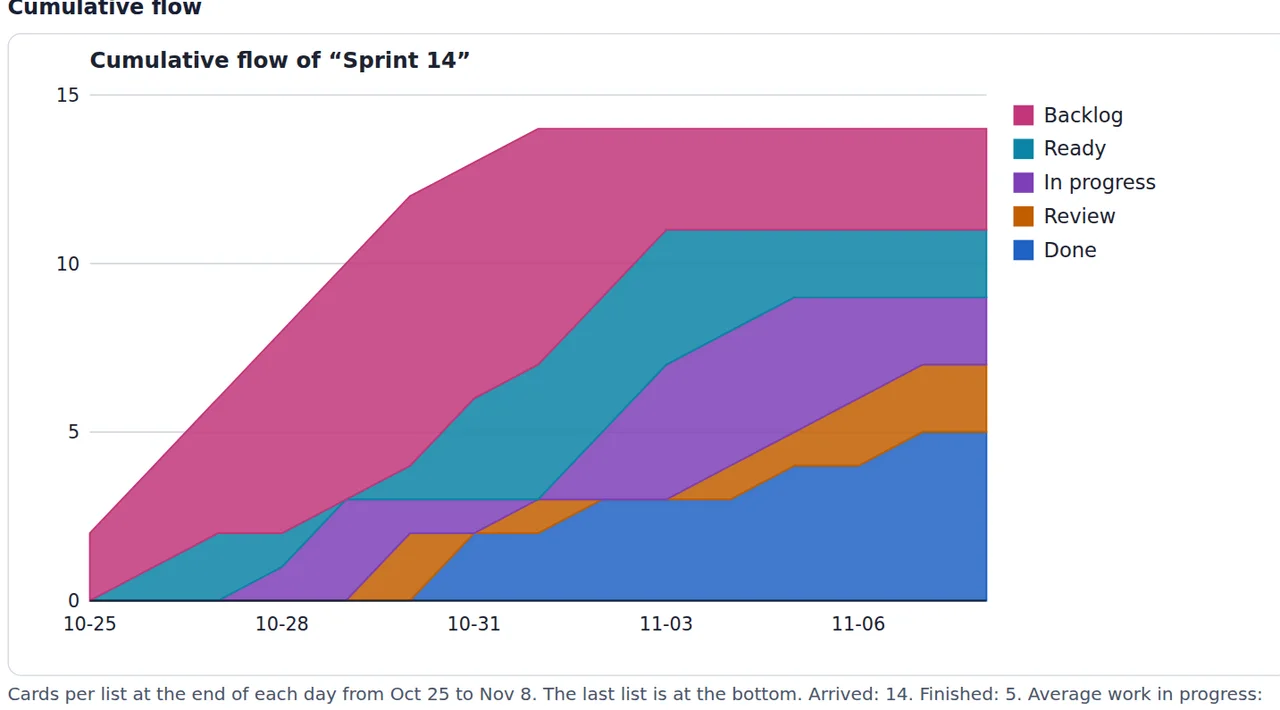
Below the chart Laneboard estimates the lead time with Little’s law: average work in progress divided by the cards finished per day. That is an estimate for a stable flow, not a measured time. Show the daily numbers opens the same data as a table; Download the chart (SVG) and Download every card as CSV save them.
Good to know
- Archived cards leave the chart on the day they were archived, but a card that reached the done list before it was archived still counts as finished.
- Cards moved before Laneboard knew them (for example older parts of a Trello history) only count from their first recorded step.
- The tools laneboard-board-stats and laneboard-cumulative-flow compute exactly the same numbers from a board file — for scripts and AI agents via the API and MCP.
Ready to try it?